Several years ago I stumbled upon Mermaid.js tool – a really nice and easy JavaScript diagraming library. Obviously, the developer inside me never cease to exist… Back then I was thinking about learning it’s script language in order to use it as a workshop assistant while working on a business analysis. Wanted to make use of it and speedup the visualization of business process, rather then drawing it manually in Visio. To make long story short – it didn’t work, at least for me in a business analyst role. It’s still a great tool!
Then, you’ll guess, the AI became mainstream and I wanted to give it a second chance. Thinking about it, I was planning to start with instructing the AI on how to work with the Mermaid.js, to teach it the rules how to generate the script. Well, a bit ashamed, that was a joke on me 🙂 …ChatGPT already knows that 🙂
Let’s get down to work…
The idea is to reuse the same text (user story) you go through the workshop with the customer and with some “magic” create an image out of it, as we all know – picture is worth a thousand words.
The steps I’ll demonstrate include:
- Give your favorite GPT companion an input – say what you want it to generate and write your user story
- Copy/paste the output to Mermaid Live Editor and voilà
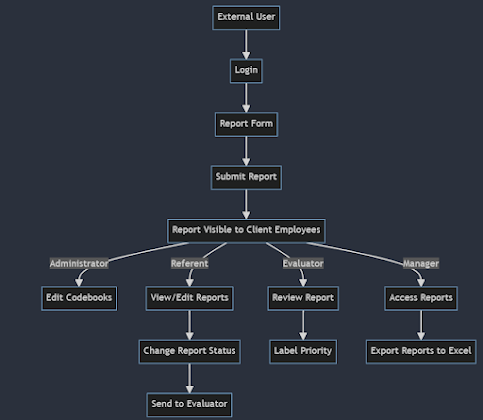
Create a flowchart diagram with mermaid.js script based on the following scenario:External users access public web application hosted on client infrastructure.External users needs to be registered and logged in, in order to send a report. They use a form to enter details on that report. Once completed that report is visible to client employees for futher processing.Client employees are categorized in four roles: administrator, referent, evaluator, manager.
Administrator needs to be able to see all features of the application, edit codebooks for the report form, but cannot make any changes to the reports themselves.
Referent can only view and edit reports sent by external users, change status of the report and by doing so send it to evaluator user.
Evaluator is responsible to review sent report and make decision about seriousness of the side effect by labeling it with a priority (1 to 5, 5 being most serious).
Manager is a ready only role who access all of the reports through predefined set of table reports which can be exported in Excel for further data analysis.
graph TD;A[External User]–>B[Login];B–>C[Report Form];C–>D[Submit Report];D–>E[Report Visible to Client Employees];E–>|Administrator|F[Edit Codebooks];E–>|Referent|G[View/Edit Reports];G–>H[Change Report Status];H–>I[Send to Evaluator];E–>|Evaluator|J[Review Report];J–>K[Label Priority];E–>|Manager|L[Access Reports];L–>M[Export Reports to Excel];
Leave a Reply